
Year 2025 and Important Moments in the Shipping Container Industry
Year 2025 represents a breakthrough period in the global container shipping industry, which was influenced by a convergence of geopolitical, economic, environmental, and technological factors. After a period of extreme volatility caused by the COVID-19 pandemic, global container shipping in 2025 faced not only lingering pandemic consequences, but especially new challenges: geopolitical instability, regulatory interventions by superpowers, changes in global trade flows, structural overcapacity, rising operating costs, and pressure on decarbonization.
These factors together transformed traditional trade routes, carrier strategies, and shipper behavior. The result was a paradoxical development: despite some pessimistic forecasts, the global container market recorded volume growth, but at the cost of higher complexity, increased volatility in shipping rates, and increased environmental impacts.
Key Facts (2024/2025):
| Indicator | Value/Trend |
|---|---|
| Global container shipping volume (2024) | 183.2 million TEU (+6%25 y/y) |
| Average daily container movement (2024) | 502,470 TEU |
| Estimated growth of global container market (2025) | -1%25 to +4%25 (Maersk, May 2025) |
| Largest regional growth (2024) | North America (+12%25 imports) |
| Average shipping route length (2024/2025) | +6%25 increase in “ton-miles” |
| Emissions from maritime shipping (2024) | +5%25 (impact of route changes) |
Key Factors Affecting the Market in 2025
Geopolitical Tension and Route Reconfiguration
Situation Description:
In 2025, geopolitical conflicts and regional security threats became a daily reality of maritime route operations:
- Red Sea Crisis: Attacks on commercial vessels in the Red Sea region escalated to the point where most major carriers (Maersk, MSC, CMA CGM, Hapag-Lloyd, …) completely stopped using the Suez Canal. Ships were forced to choose routes up to 30%25 longer around the Cape of Good Hope.
- Panama Canal Restrictions: A significant drop in water levels (a consequence of climate change, El Niño) limited the number of ships able to pass through, increasing pressure on east-west trade routes.
- New Routes and “Geopolitical Chokepoints”: Regions such as the Strait of Malacca, Hormuz, the Bosphorus, or the Strait of Gibraltar are becoming key points in terms of security and capacity.
Market Consequences:
- Average shipping time between Asia and Europe extended by 9–14 days.
- Significant increase in fuel consumption and CO₂ emissions (in 2024 alone, a 5%25 increase in global maritime shipping emissions).
- Artificial reduction in available capacity (ships and containers are tied up on longer routes).
- Increased insurance and security costs.
Regulatory Challenges and Trade Policy
Regulatory Interventions in 2025:

- New American Tariffs and Fees (USTR, Section 301):
- Targeted at ships owned or built in China heading to the USA.
- Introduction of fees for net tonnage (flat fee for Chinese operators) and TEU capacity (for non-Chinese operators with Chinese ships).
- Expected impact: up to $3.2 billion annually for the largest carriers (COSCO Group up to $1.53 billion).
- European Environmental Fees:
- Expansion of the EU ETS (Emissions Trading Scheme) to maritime shipping from 2024/2025.
- Obligation to pay for CO₂ emissions when anchoring in European ports.
Carrier Strategies:
- Reassessment of fleet deployment, relocation of ships to other routes.
- Accelerated shift away from dependence on Chinese shipyards and products.
- Greater emphasis on compliance and reporting of environmental data.
Supply and Demand Balance
Supply Side:
- Massive Influx of New Ships: Orders from 2021–2023 brought a record number of new container ships (in 2025/26, fleet growth +3.6%25).
- Low Scrapping Rate: Average ship age is historically low, decommissioning of older units minimal.
- Container Park: Global container fleet is growing, but not as fast as ship capacity.
Demand Side:
- Demand Growth Slowing: Demand growth predictions only 2.5–3%25 (CTS, Maersk).
- Change in Demand Structure: Strong growth in Africa, India, ASEAN; stagnation or decline in the USA.
Resulting Effect:
- Structural overcapacity (so-called “overcapacity”).
- Pressure for rate decline, increased competition among carriers, need for fleet optimization (blank sailings, slow steaming).
Pricing and Shipping Rates
Rate Development (2024/2025):
- Rates at the beginning of 2025 extremely volatile (SCFI in 2024 on average 149%25 higher than in 2023).
- With market adaptation to new routes and the arrival of new ships, rates began to decline in the 2nd half of 2025.
| Rate Type | 2024 (average) | 2025 (trend) | 2026 (forecast) |
|---|---|---|---|
| Long-term contracts | +15%25 | stabilization | decline of 10–15%25 |
| Spot rates | +40–150%25 | decline | decline up to 25%25 |
Factors Affecting Rates:
- Geopolitics and “force majeure” events (e.g., Red Sea attacks).
- Carrier capacity strategies (blank sailings, slow steaming).
- Seasonal fluctuations (e.g., pre-Christmas peak, Chinese New Year).
Status and Trends of Global Container Trade
Volume Growth and Market Performance
Statistical Data:
- According to Container Trades Statistics Ltd. (CTS), 183.2 million TEU were shipped in 2024, representing year-on-year growth of 6%25 (record volume).
- Average daily container movement in 2024: 502,470 TEU.
- In 2025, volume growth was estimated between -1%25 to +4%25 depending on region and conflict developments (Maersk, May 2025).
| Region | Volume Growth 2024 | Trend 2025 |
|---|---|---|
| North America | +12%25 (import) | stagnation/decline |
| Far East | +8%25 (export) | growth |
| Europe | mild growth | stable |
| Africa | +20–25%25 | strong growth |
Regional Shifts and Emerging Markets
Global Shifts:
- China Diversifies Exports: In response to American tariffs and trade conflicts, exports to Europe (+10–15%25), Africa (+20–25%25), and ASEAN (+6–8%25) grew.
- India in the Role of “China+1”: Rising importance of India in the global supply chain, massive growth in electronics, pharmaceuticals, and consumer goods exports.
- Tanzania and East Africa: Significant logistics hub for transit to landlocked countries (Uganda, Rwanda, Congo).
- USA: Decline in imports due to tariffs and the trend of nearshoring to Mexico (decline in imports in 2025 by approximately 5.6%25).
Table: Fastest Growing Markets in 2025
| Country/Region | Growth Characteristics |
|---|---|
| India | New export hub, infrastructure growth |
| Philippines | Rapid growth in manufacturing and consumption |
| Tanzania | Key gateway to East Africa |
| Vietnam | Alternative to China in electronics, textiles |
Technological and Environmental Aspects
Decarbonization and Alternative Fuels
IMO and Legislative Pressure:
- The goal is climate neutrality of maritime shipping by 2050 (IMO).
- From 2024/25, obligation to pay for CO₂ emissions in EU ports (EU ETS).
Technological Trends:
- Methanol: In 2025, a significant decline in new orders for methanol-powered ships (from 50%25 in 2023 to 12%25 in 2025); the reason is concerns about the availability of green methanol.
- LNG: Liquefied natural gas accounts for 60%25 of newly ordered capacity – a transitional solution, but still with an emissions footprint.
- H2 and Other Fuels: Development of hydrogen-powered ships is still in the pilot phase.
- Port Automation: Boom in fully automated high-bay warehouses in ports (see Xpert Digital), which significantly increases efficiency and reduces costs and downtime.
Reality of 2025:
- Only 8%25 of the world fleet equipped for alternative fuels.
- Longer routes (circumnavigating Africa) increase emissions and fuel consumption.
Container Market: New vs. Used
| Container Type | Manufacturing/Supplier | Average Price 2025 | Advantages/Disadvantages |
|---|---|---|---|
| New (One-trip) | 95%25 manufacturing in China | Stagnating prices | Higher quality, warranty |
| Used | Worldwide, secondhand | Fluctuating prices | Lower quality, higher age |
- New Containers: Chinese factories continue to dominate manufacturing, prices remain relatively stable despite fluctuations in shipping rates.
- Used Containers: The average age of sold units has shifted to 10–20 years. In the USA and Europe, demand for quality used containers is higher than supply, which pushes buyers more towards “one-trip” containers.
Technical Innovations:
- Sensors for monitoring position, temperature, humidity (IoT containers).
- New materials and surface treatments for higher durability and lifespan.
What Does Year 2025 Mean for the Future?
Year 2025 showed that the container shipping industry has entered a phase of permanent uncertainty and constant change. Key topics – geopolitics, regulatory challenges, environmental pressure, new technologies, and structural overcapacity – will determine the direction of the entire sector in the years to come.
Resilience and adaptability are becoming key factors for survival. The future of carriers and supply chains will depend on the ability to quickly respond to route changes, diversify sources, and invest in innovations – whether in propulsion, digitalization, or risk management.
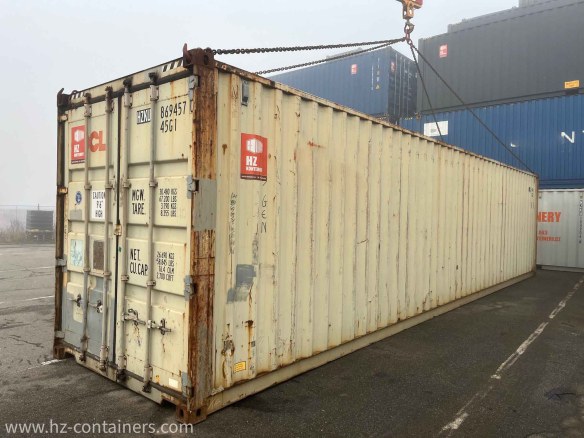
 Dunajská Streda, Slovakia
  WITHOUT SHIPPING
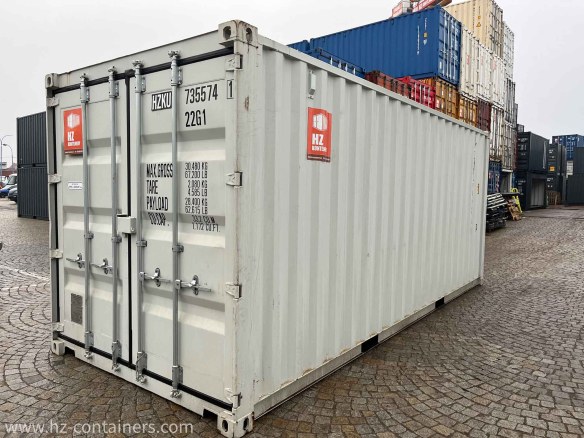
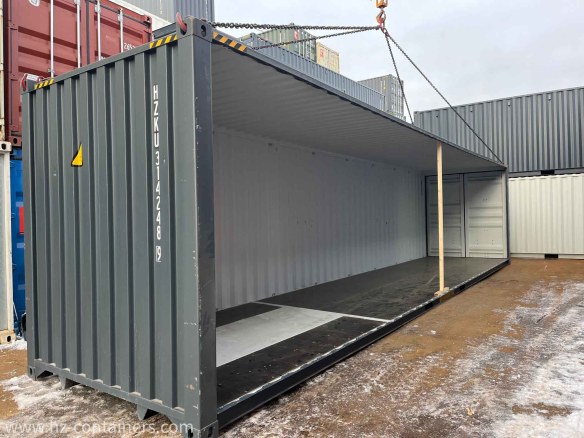
Other container news...

The OPNBar leverage tool
The OPNBar leverage tool is a professional-grade, multi-purpose hand tool designed specifically for the shipping container and trucking industry. Manufactured by Shipping Container Safety International (SCS International) and proudly Made in the USA, the OPNBar is fundamentally a 3-in-1 trucker tool that combines a shipping container door leverage bar, a tire thumper, and a 5th wheel pull hook into a single, compact steel implement. The name “OPNBar” is a direct reference to its primary function: it is the bar that “opens” containers.

40 Foot Container Dimensions
If you have ever booked ocean freight, planned a warehouse layout, or designed a modular building project, you have asked the same question: what are the exact 40 foot container dimensions — and what do they mean for what you can actually load? The numbers are standardized worldwide, but the practical implications of those numbers are surprisingly nuanced. A 40-foot container is not simply 40 feet of usable space, and its weight limits are not what most people assume. This guide covers every measurement, every weight rating, and every loading consideration you need to make informed decisions about the world’s most common shipping container.
Quick Answer: A standard ISO 40-foot shipping container measures 12.19 m (40 ft) long × 2.44 m (8 ft) wide × 2.59 m (8 ft 6 in) high externally and provides approximately 67.7 m³ (2,390 ft³) of usable internal volume. The maximum gross weight is 30,480 kg (67,200 lbs), with a typical payload capacity of approximately 26,700–26,800 kg (58,900–59,000 lbs).

Shipping container wheels
Moving a 12-meter-long steel box that weighs up to 67,200 pounds was, for decades, exclusively a job for a crane and a licensed operator. That reality has changed. Shipping container wheels — an umbrella term covering a family of mobility solutions — now let a single person reposition a 20ft or 40ft container across a yard, warehouse, or construction site without calling in heavy equipment. This guide covers every aspect of container wheel systems: what they are, how they work, the types available, what they cost, and how to choose the right kit for your container.
Can You Modify a 40ft High Cube Container?
The short answer is yes — you absolutely can modify a 40ft high cube container, and it is one of the most popular container types for modification projects worldwide. But the real question is not whether you can modify one; it is how to do it correctly, safely, legally, and within budget. This guide answers every dimension of that question, drawing on engineering principles, real-world pricing data, and the collective experience of thousands of modified container projects.
Key Takeaway: A 40ft high cube container offers 320 square feet of floor space with an extra foot of ceiling height compared to a standard container — making it the ideal canvas for offices, workshops, homes, retail spaces, and industrial applications. The extra height is particularly valuable when you add insulation and still want comfortable headroom.